Biggest trends of data visualization
You will have data inside your business from existing customers, market research and sales figures. These may have geography attached to them in terms of postcodes, addresses or regions. If you capture market segment or demographics as well as sales, volumes and values, you will have a host of rich resources locked away and offering you a huge potential for discovery.
The discovery through data visualisation turns information into intelligence, numbers into meaningful assets and location into decision making tools.
1) Social First Data Visualizations
RJ Andrews from Info We Trust is hoping to see more data storytelling created with social media in mind first. “It’s almost like content stumbles onto social right now,” he explained, “it is something that has yet to be figured out in a compelling way, but the community is slowly becoming aware. Social can mean a lot of things – looping animations, GIFs, YouTube shorts – these are formats dataviz is slowly breaking into”.
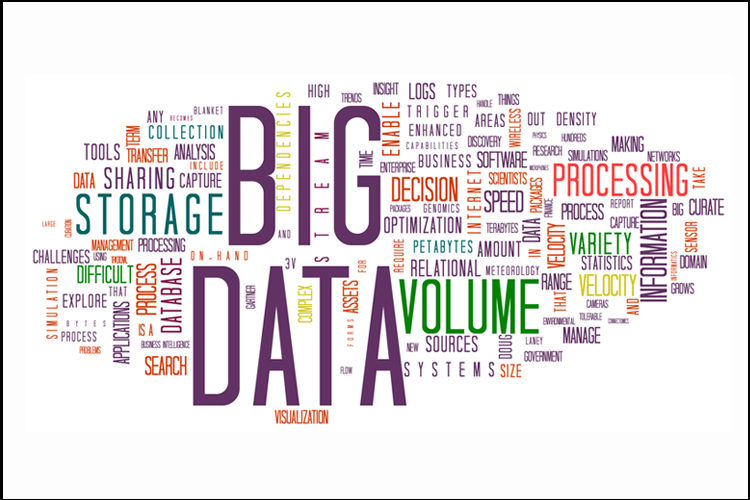
2) Big Data Becomes Approachable
2016 was a huge year for big data, with more organizations collecting, processing, and analyzing data sets of all forms and sizes. We expect to see more systems that support large volumes of data in 2017, and even easier ways for end users to extract value from the numbers.
3) Push for Accuracy and Truth
One huge underlying theme we kept hearing from our experts in regards to data visualization this year was truth. Towards the end of 2016 data literacy went from nice-to-have to a must-have.
Consultant and speaker Bill Shander would like to see an increased focus on facts. “Being truthful and clear with data has always been at the core of the visualization field,” he said. “But this year, with the cacophony about ‘fake news’ and political speech (and references to statistics) being more hyperbolic and less factual than usual, the focus is increasing. There has recently been an endless stream of commentary on truth in data that I think will dominate the conversation for quite a while.”
4) Storytelling and Narrative Still Going Strong
Narrative is more important than ever. The term ‘storytelling’ is not a buzzword, it’s just gotten a bad reputation. Catherine Madden explains: “Storytelling and narrative are totally real, but I just think they have lost some meaning thanks to overuse. A word I’ve started to use a bit more is ‘packaging.’ I think that people are starting to realize that the data and subsequent visualizations can’t just speak for themselves, and you need to figure out how to wrap it up and what else to include for it to truly inspire action.”

